Topical Authority Overview: Vendor Infographics in the PLM/Engineering Context
Definition
Vendor infographics are graphical representations that provide concise, visually appealing information about a particular product or service offered by a vendor within the context of Product Lifecycle Management (PLM) and engineering. These visual aids often serve to enhance communication, facilitate understanding, and highlight key features or benefits in a manner more engaging than traditional text-based documentation.
History
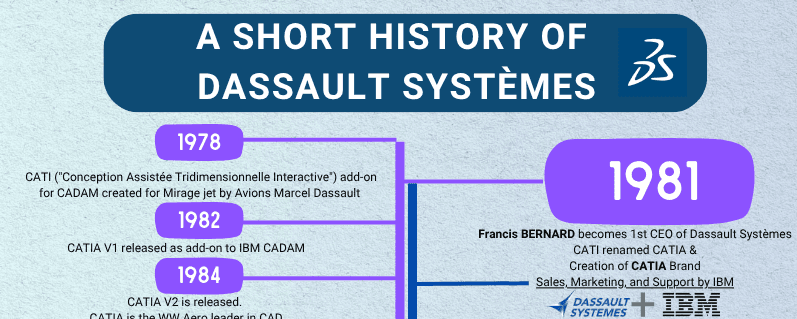
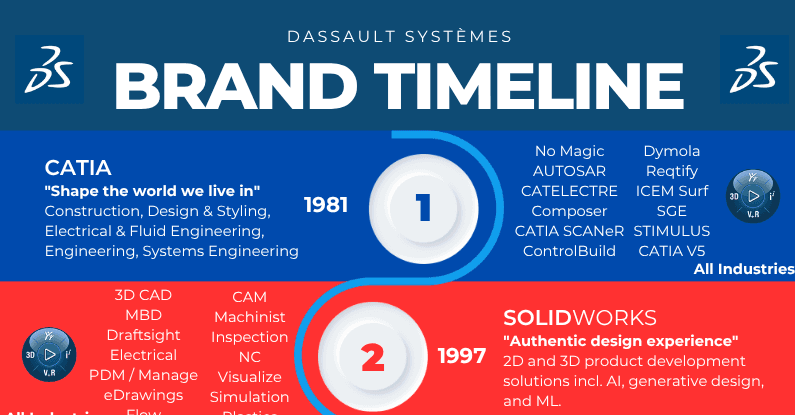
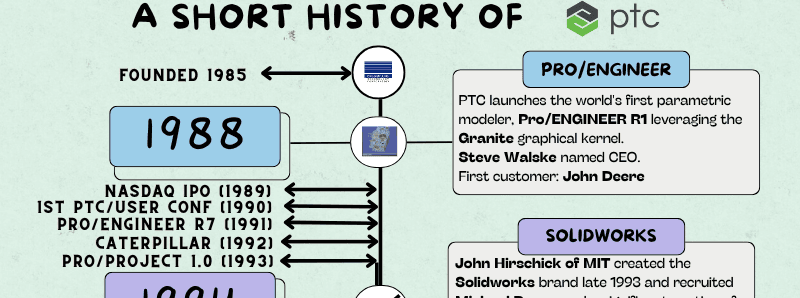
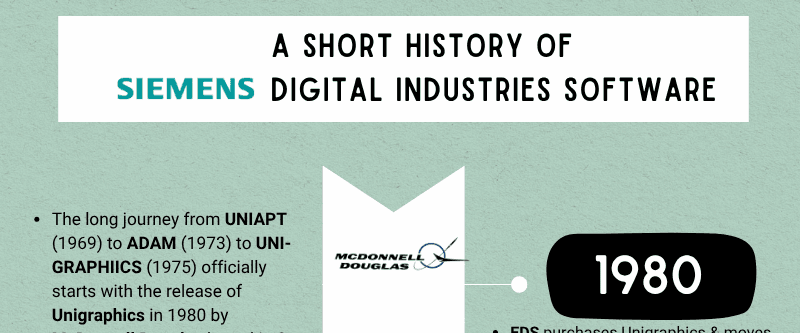
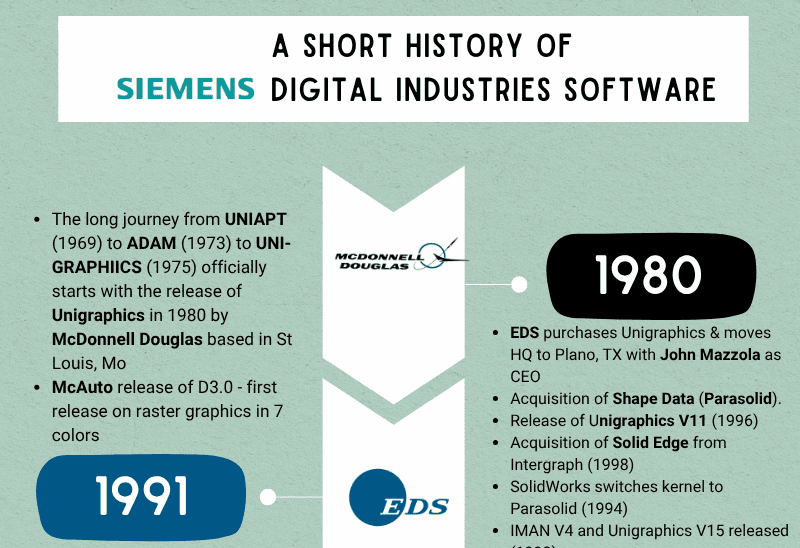
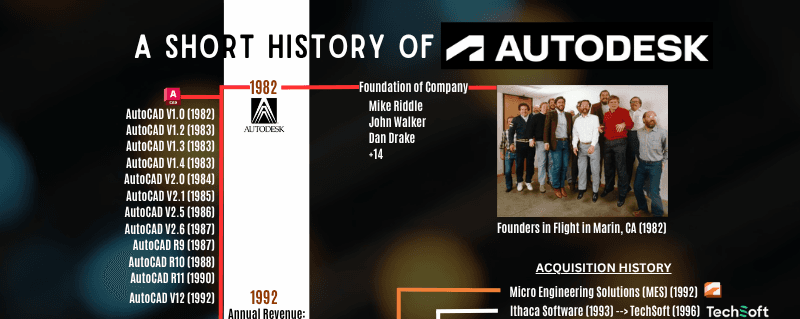
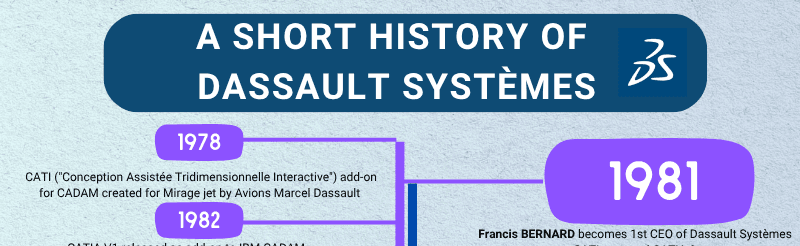
The use of infographics in business has evolved significantly over recent decades. Initially, they were primarily used for internal communication within organizations. However, the advent of digital tools and the rise of social media platforms have transformed their application to external marketing and public relations purposes. In the PLM context, the integration of vendor infographics began with software vendors like Autodesk and Dassault Systèmes, which recognized the value in simplifying complex information for clients.
Key Concepts
- Data Visualization: Infographics leverage visual elements such as charts, graphs, icons, and images to convey data or processes clearly.
- Branding and Identity: Vendor infographics often incorporate branding elements to reinforce brand identity and consistency across various marketing materials.
- Information Clarity: Effective use of color schemes, typography, and layout ensures that the key messages are easily understood by diverse audiences.
- Engagement and Accessibility: By making information visually engaging, vendors can capture attention more effectively and ensure that complex technical details are accessible to non-experts.
Current Trends
- Digital Transformation: The shift towards digital tools has facilitated the creation and distribution of infographics through platforms like social media, websites, and intranets.
- Sustainability Focus: Many infographics now highlight environmental benefits or sustainable practices associated with a vendor’s offerings, appealing to eco-conscious clients.
- Interactive Elements: Utilizing interactive features such as animations, clickable elements, and QR codes in infographics can enhance user engagement and interaction.
- Multilingual Support: With globalization, many infographics are designed to support multiple languages, ensuring broader reach and accessibility.
Relevance to PLM Practitioners
For professionals involved in PLM, vendor infographics offer several strategic advantages:
- Enhanced Communication: They can improve communication between stakeholders by presenting technical information in a digestible format.
- Decision Support: Infographics provide quick visual overviews that assist in making informed decisions about product design and lifecycle management strategies.
- Innovation and Trend Analysis: By visualizing complex data, infographics help PLM practitioners identify trends and opportunities for innovation within their industry.
- Client Engagement: Tailored infographics can enhance client relations by providing clear, engaging content that showcases a vendor's expertise and value.
In conclusion, the use of vendor infographics in the PLM/Engineering context is not just about aesthetics but about leveraging visual communication to address the needs of diverse audiences effectively. As technology continues to advance, the role of these graphics will likely become even more integral to successful product lifecycle management strategies.