Key Takeaways
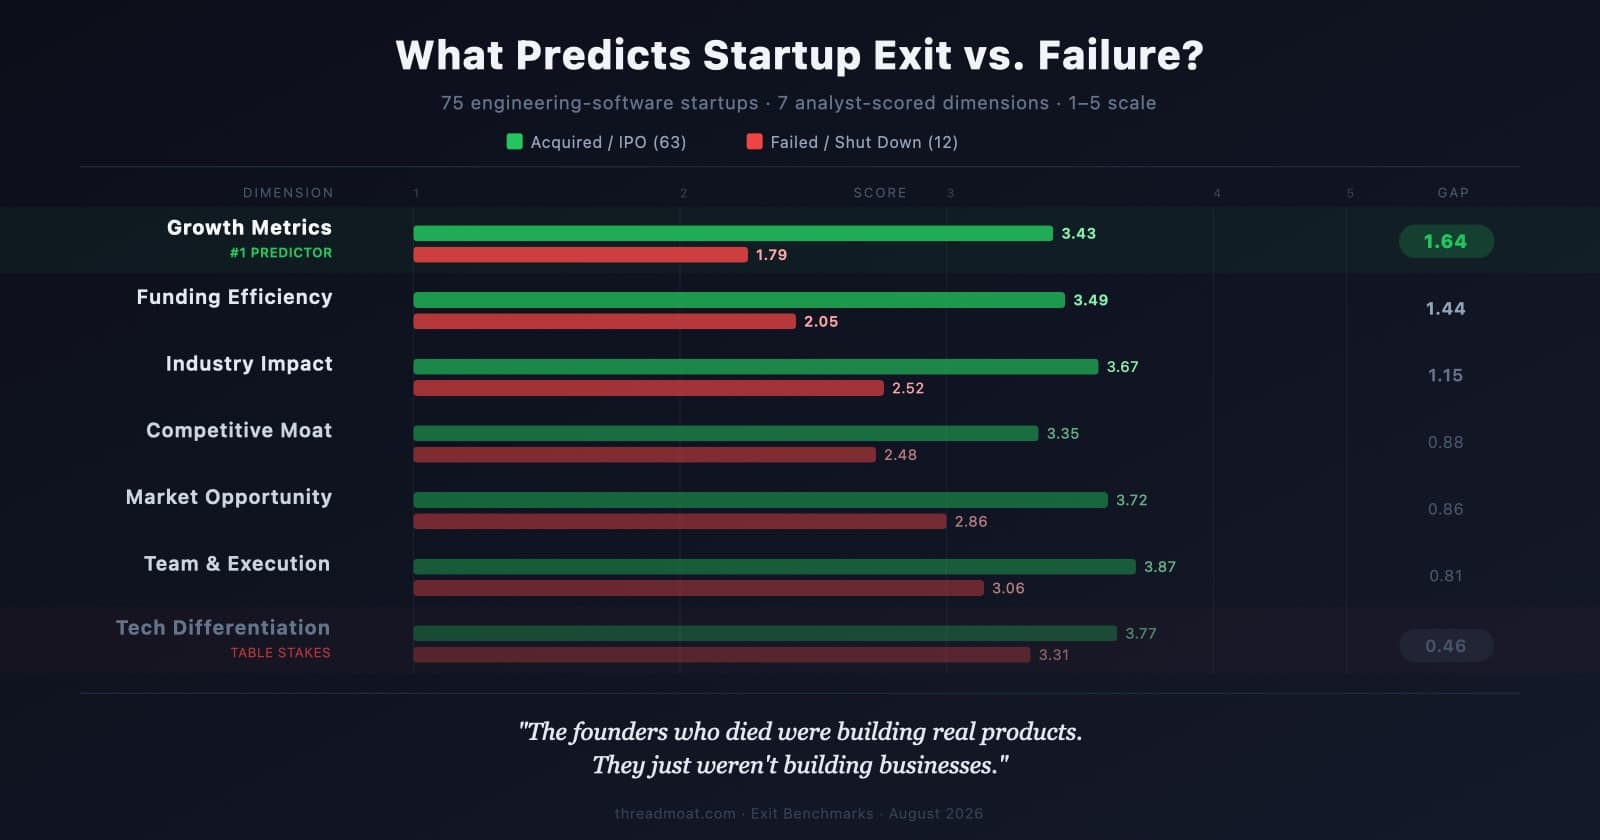
- Across 75 exited engineering-software startups, Growth Metrics (gap 1.64 on a 5-point scale) and Funding Efficiency (gap 1.44) separate acquisitions from shutdowns. Technology Differentiation (gap 0.46) barely does.
- Failed startups averaged 3.31 out of 5 on technology. A convincing demo and a strong patent portfolio are the entry ticket, not a survival signal.
- Hyperganic outscored the average acquired company in six of seven dimensions and still shut down. Its one weak score was funding efficiency; burn outran traction.
- For a buyer, an acquisition is a risk event, not a happy ending: the product you bought gets absorbed into an incumbent roadmap, repriced or retired.
- Ask five things before signing: named-customer growth, capital raised versus revenue, runway, likely acquirers, and the contractual exit path for your data and integrations.
Short Answer
ThreadMoat's exit benchmarks cover 75 engineering-software startups with a terminal outcome: 63 acquired or IPO'd, 12 shut down. The dimensions that separate the two groups are Growth Metrics (acquired 3.43 versus failed 1.79) and Funding Efficiency (3.49 versus 2.05). Technology Differentiation separates them least (3.77 versus 3.31). For a PLM or engineering-IT buyer this means vendor due diligence should weight visible customer growth and capital efficiency above the technical demo, and should treat acquisition by an incumbent as a scenario to contract for, since the product you bought may be absorbed, repriced or retired.
- The average acquired company scored 3.67 weighted; the average failure scored 2.68. Flat growth at the time of scoring (1.79 average) was the clearest marker of failure.
- Funding Efficiency is the dimension acquirers run the math on: a company that raised $60M to build $50M of enterprise value is a bad deal for everyone, including its customers.
- Market Opportunity (gap 0.86) and Team & Execution (gap 0.81) are mid-table predictors; a big market and a credible team do not by themselves keep a vendor alive.
- Recent industrial-AI acquisitions show what absorption looks like for customers: roadmaps merge into the incumbent's release cadence and standalone pricing disappears.
- The right contract asks for data export in open formats, API continuity commitments, source escrow and a change-of-control clause.
Every founder believes their technology is why they will win, and in industrial AI the technology usually is good. ThreadMoat scored 75 engineering-software startups that reached a terminal outcome, 63 acquired or IPO'd and 12 shut down, across seven dimensions, and found that technology was the worst predictor of which group a company ended up in. The full analysis is in What Actually Predicts Whether a Startup Gets Acquired, or Dies? on ThreadMoat, and the underlying data is live in the Exit Benchmarks dashboard (subscriber access).
This companion is for the other side of the table: the PLM, engineering-IT or manufacturing lead who has an AI-native vendor inside a production workflow and needs to know whether it will still be there in three years.
Your due diligence is weighted on the wrong slide
| Dimension | Acquired avg | Failed avg | Gap | |---|---|---|---| | Growth Metrics | 3.43 | 1.79 | 1.64 | | Funding Efficiency | 3.49 | 2.05 | 1.44 | | Industry Impact | 3.67 | 2.52 | 1.15 | | Competitive Moat | 3.35 | 2.48 | 0.88 | | Market Opportunity | 3.72 | 2.86 | 0.86 | | Team & Execution | 3.87 | 3.06 | 0.81 | | Technology Differentiation | 3.77 | 3.31 | 0.46 |
Read the bottom row first. The companies that shut down averaged 3.31 out of 5 on technology. That is a solid product built by competent engineers solving a real problem, and it is roughly what your technical evaluation team will conclude after the proof of concept. They died anyway.
Now the top two rows. Failed startups averaged 1.79 on growth, which is effectively flat at the time of scoring. And funding efficiency, the dimension nobody discusses in a sales cycle, has the second-largest gap. A company that raised heavily to build modest value is a bad deal for acquirers, which means when the money runs out nobody steps in at a price the cap table can absorb.
Most enterprise vendor evaluations spend eighty percent of their effort on the row with the smallest gap.
The Hyperganic lesson
The most instructive company in the dataset is one that should have been acquired. Hyperganic scored 4.11 weighted, above the average acquired company at 3.67, and beat the acquired average in six of seven dimensions: 4.80 on market opportunity, 4.20 on technology, 4.30 on moat. Its one lagging score was funding efficiency at 3.0. It shut down in 2024 and pivoted into Leap71.
If you were a Hyperganic customer, every signal your evaluation process could read was green. The one that mattered was in the cap table.
An acquisition is a risk event for you, too
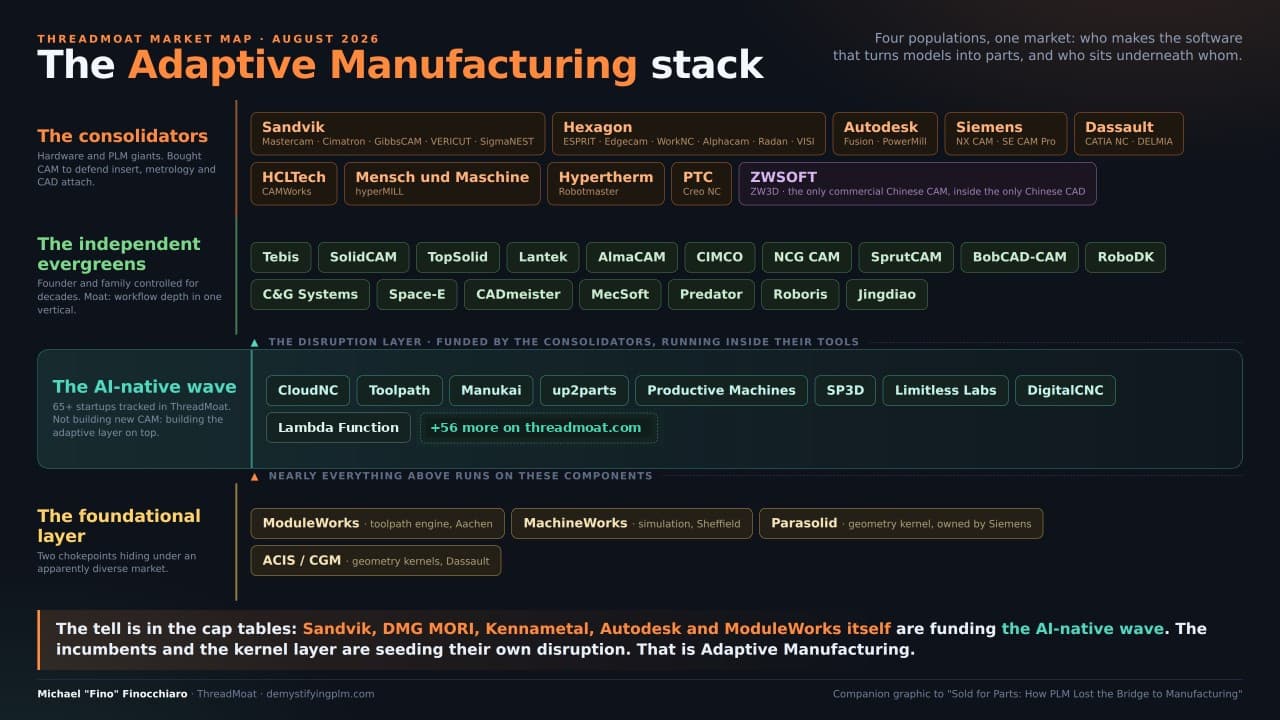
The dataset frames acquisition as the good outcome, and for investors it is. For a buyer it is a change-of-control event with a predictable shape. The product moves onto the acquirer's roadmap and release cadence. Standalone pricing and support tiers get revised. Integrations with the acquirer's competitors lose priority. The 2026 acquisition wave in industrial AI has already shown this pattern, and the Adaptive Manufacturing layer, where incumbents are funding, shipping and buying the same startups they compete with, is where it will show next.
So the goal is not to pick vendors that will be acquired. It is to pick vendors that will survive in some form, and to contract for the form changing.
Five questions that map to the predictors
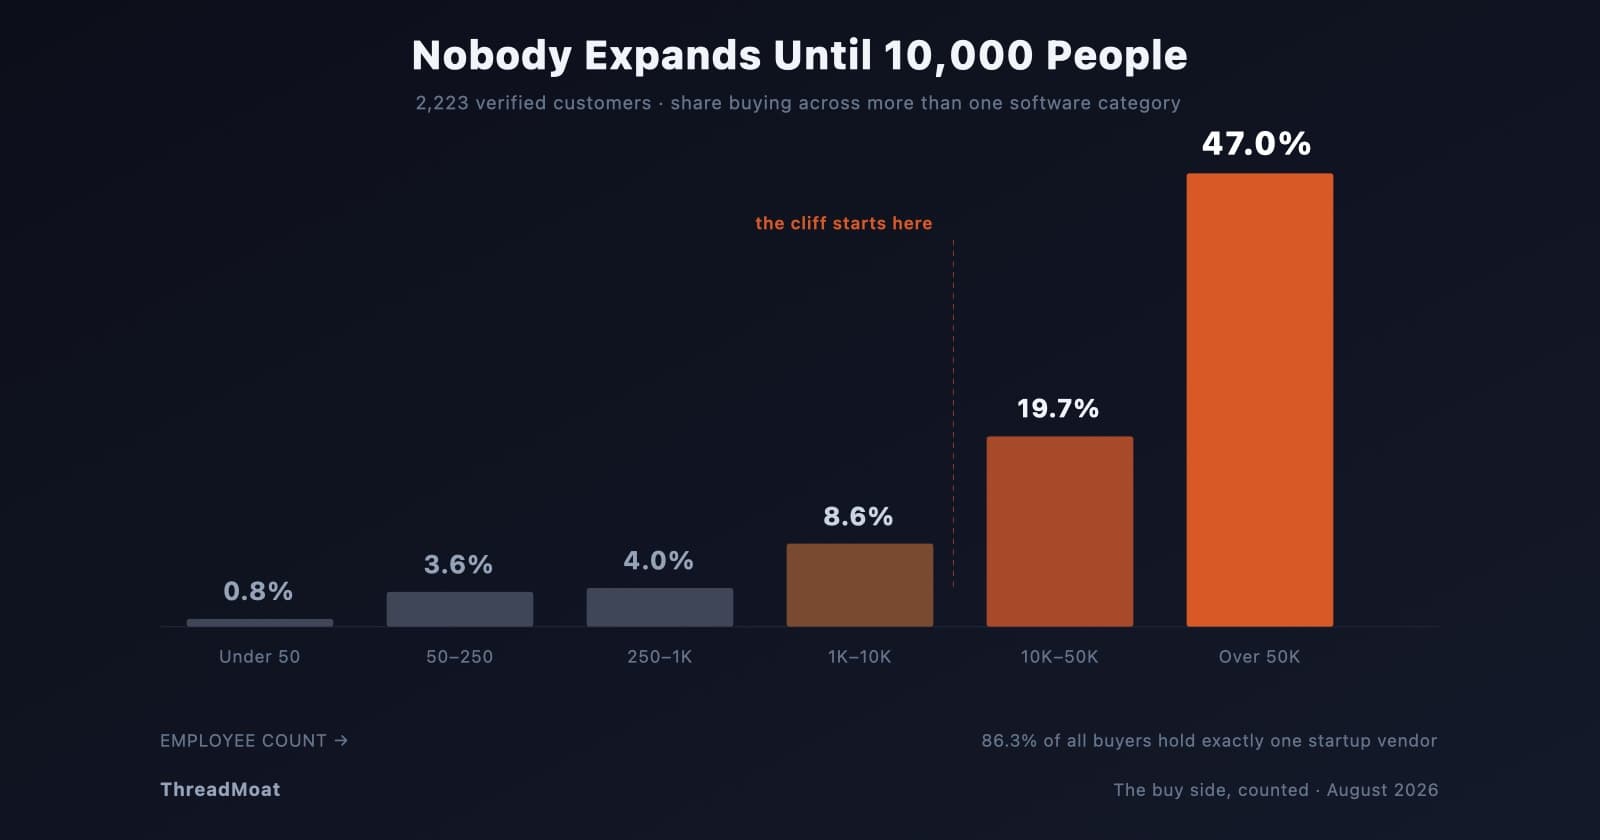
- Growth. How many named production customers did you have a year ago, and how many today? ThreadMoat's buy-side census found that only 47% of tracked startups can name a customer at all, so a vendor that can is already ahead of the base rate. See the companion on what the buy-side data means for PLM leads.
- Funding efficiency. How much capital has been raised, and what is current revenue? You will not get exact numbers; the ratio of what they will say to what they will not is itself informative.
- Runway. How many months at the current burn, and when is the next raise planned? A vendor raising in the next two quarters is a vendor whose roadmap may change in the next three.
- Likely acquirers. Which incumbents are on the cap table, integrated into the product, or already customers? Those are the plausible buyers, and their competitors are the integrations at risk.
- Exit path. Data export in open formats, API continuity commitments, source escrow and a change-of-control clause. This is the part of the contract that protects you against vendor lock-in in both directions, shutdown and absorption.
The uncomfortable bottom line
Good technology in a big market is the minimum bar for existing in engineering software. Every serious vendor you evaluate will clear it, including the ones that will not be here in three years. What separates them is whether they grew and whether they did it without lighting money on fire, and neither shows up in the demo. Ask for the numbers that do.
Source data and full analysis: What Actually Predicts Whether a Startup Gets Acquired, or Dies? and the ThreadMoat Exit Benchmarks (subscriber access). Scores are analyst-assigned as of August 2026; sample 63 acquired/IPO, 12 shutdown.
Cite this article
Finocchiaro, Michael. “Vendor Risk: What Startup Exit Predictors Mean for Your PLM Stack.” DemystifyingPLM, September 6, 2026, https://www.demystifyingplm.com/insights/startup-vendor-risk-exit-predictors