Topical Authority Overview: Data and Digital Transformation Infographics in PLM/Engineering Context
Definition and History
Data and digital transformation infographics play a pivotal role in visualizing complex data governance strategies, digital thread applications, and the integration of digital twins within Product Lifecycle Management (PLM) systems. These infographics serve as powerful tools for conveying intricate concepts and current trends to engineers and PLM practitioners, enhancing their understanding of how digital transformations impact their work.
The concept of data and digital transformation has roots in the early 21st century when businesses began leveraging information technology to streamline operations and gain competitive advantage. Over time, these practices evolved from simple digitization efforts to comprehensive digital strategies that integrate artificial intelligence, machine learning, and Internet of Things (IoT) technologies into core business processes.
Key Concepts
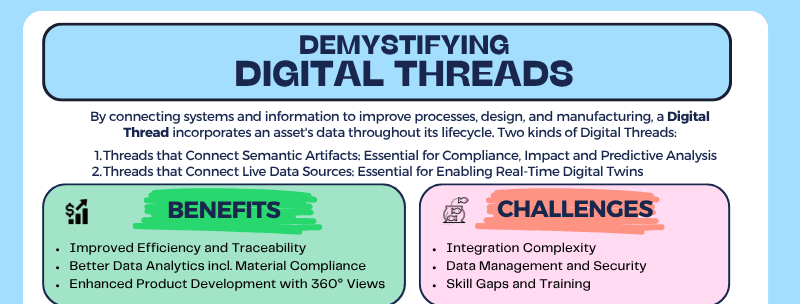
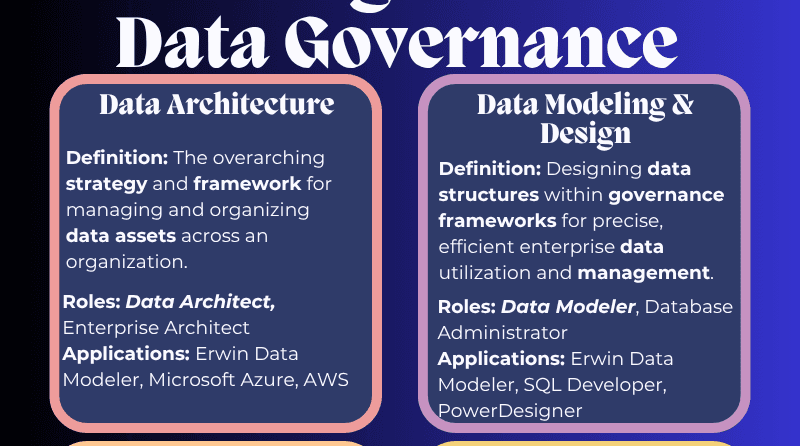
Data governance focuses on establishing policies and procedures for managing data across an organization. This includes ensuring the quality, integrity, security, and accessibility of data used in PLM systems. Digital threads represent a continuous flow of product-related information throughout the lifecycle, from design to retirement. They encompass real-time data sharing among stakeholders, enabling seamless collaboration and informed decision-making.
Digital twins refer to virtual representations of physical products or processes that enable predictive analytics and maintenance optimization. In the context of PLM, digital twins can simulate various scenarios, reducing the need for physical prototypes and accelerating product development cycles.
Current Trends
Today, several key trends are driving the adoption of data and digital transformation in PLM:
- Integration of AI and Machine Learning: Advanced algorithms can analyze vast datasets to uncover patterns, predict outcomes, and optimize processes.
- IoT and Sensor Data Utilization: Real-time data from connected devices enhances product performance monitoring and predictive maintenance capabilities.
- Blockchain for Enhanced Security and Traceability: Blockchain technology offers a secure, immutable ledger for tracking product history and ensuring supply chain integrity.
- Cloud Computing and Edge Computing: Cloud infrastructure supports scalable storage and processing of big data, while edge computing ensures low-latency responses in real-time applications.
Relevance to PLM Practitioners
For engineers and PLM practitioners, understanding these concepts through infographics is essential for several reasons:
- Enhanced Decision-Making: Visual representations help identify bottlenecks, opportunities for optimization, and areas requiring immediate attention.
- Stakeholder Communication: Clear and concise infographics facilitate communication among diverse teams, ensuring everyone understands the importance of data-driven decision-making.
- Training and Onboarding: Infographics can serve as training tools, providing new hires with a rapid understanding of PLM systems and digital transformation principles.
- Innovation and Competitive Advantage: By embracing these trends, organizations can innovate faster, reduce costs, and improve product quality, positioning themselves as industry leaders.
Top Articles in This Tag
- Data Governance Infographic: Provides an overview of data management practices, emphasizing the importance of consistency, security, and accessibility.
- Demystifying Digital Threads Infographic HD: Explains how digital threads connect design to manufacturing and beyond, highlighting their impact on product quality and time-to-market.
- Demystifying Digital Twins Infographic: Introduces the concept of virtual twins, detailing their applications in product development and maintenance.
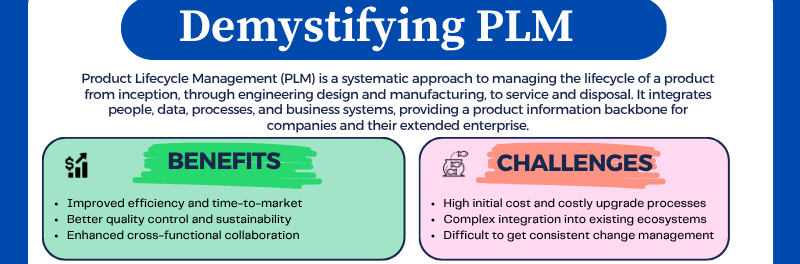
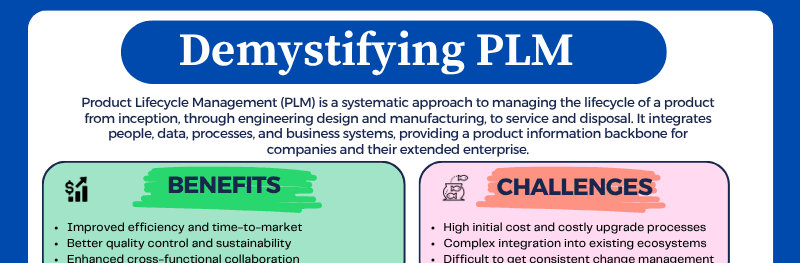
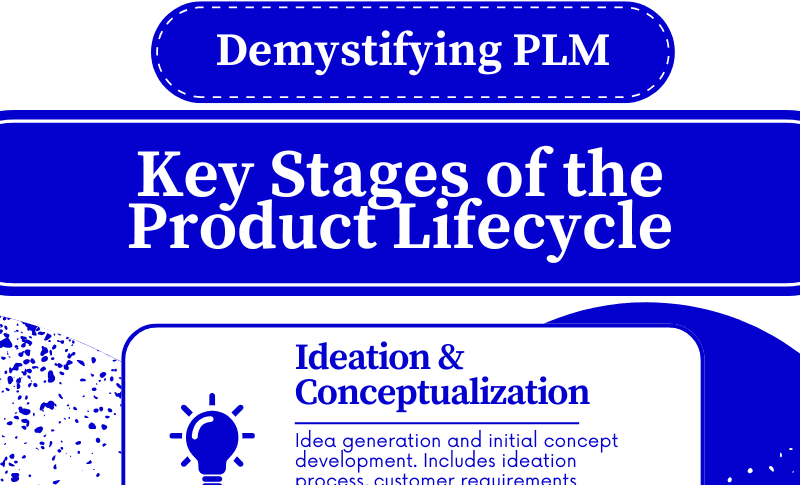
- Demystifying PLM Infographic 1: Offers insights into the fundamental components of PLM systems, illustrating how they support end-to-end product lifecycle management.
These infographics are invaluable resources for professionals looking to deepen their knowledge of data and digital transformation within the engineering context. By leveraging these visual tools, practitioners can navigate complex information more effectively, driving innovation and efficiency in their organizations.