Overview of General Infographics in the PLM/Engineering Context
Definition
General infographics are visual representations that simplify complex information into easily digestible formats. In the context of Product Lifecycle Management (PLM) and engineering, these infographics serve as tools to convey detailed processes, data relationships, and technical concepts succinctly.
History
The evolution of infographics in PLM can be traced back to the advent of digitalization in manufacturing and engineering. Initially used for basic data visualization, they have since advanced into sophisticated diagrams that encapsulate entire systems or processes within a single image. The development of tools like CAD software and PLM systems has significantly enhanced their utility.
Key Concepts
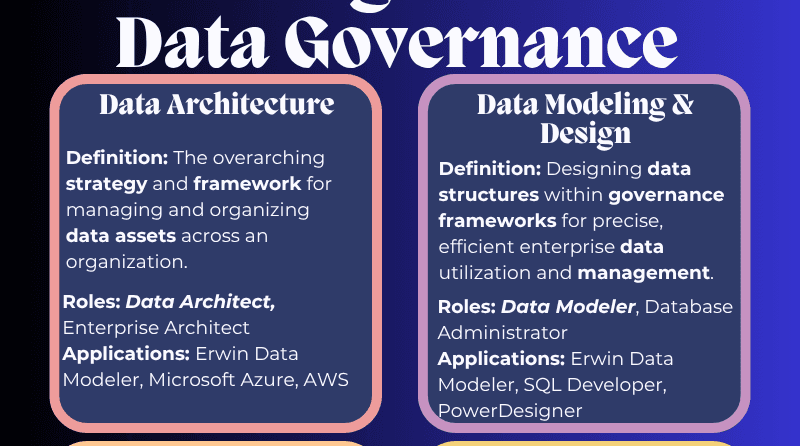
- Data Governance: Infographics can illustrate the governance frameworks governing how data is managed, shared, and used in a PLM environment.
- Digital Threads: These infographics demystify the concept of digital threads, showing how data flows across different stages from design to end-of-life.
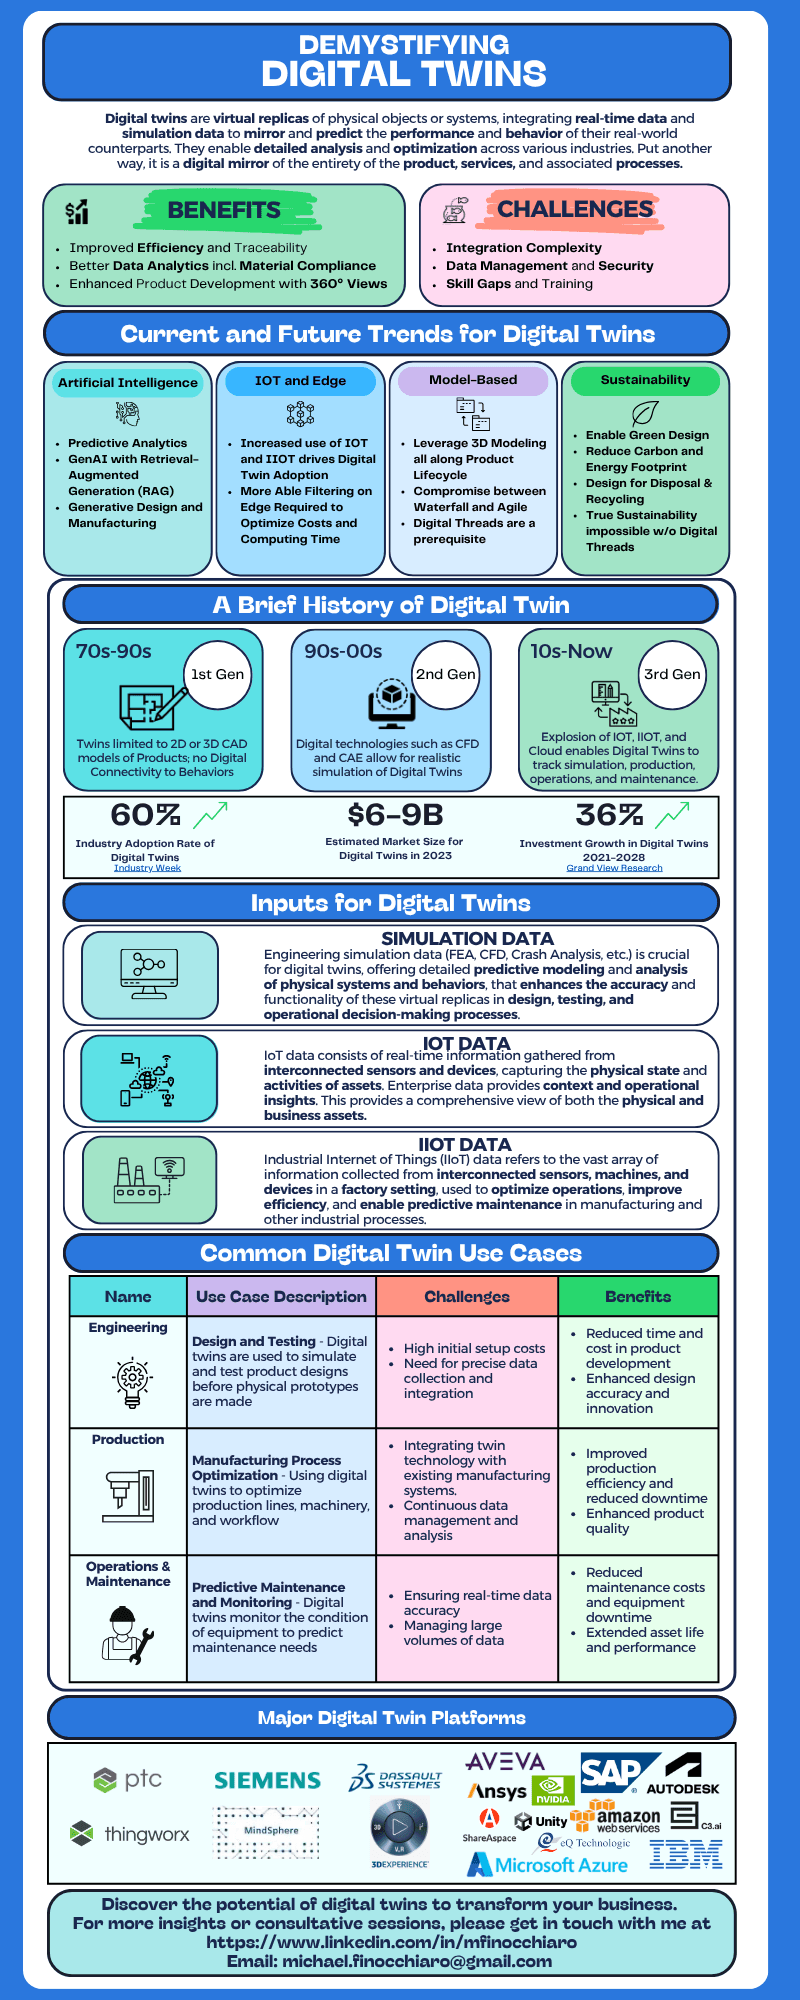
- Digital Twins: By visualizing real-world objects or processes through digital models, these infographics help engineers understand how virtual representations interact with physical counterparts in a dynamic environment.
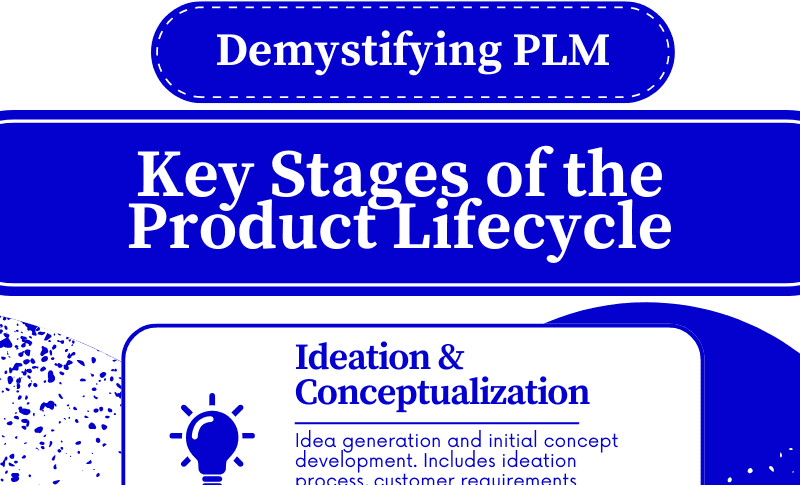
- PLM Processes: Infographics can outline the various steps and roles involved in PLM processes, making complex workflows clearer.
Current Trends
- Interactive Infographics: Incorporating interactive elements that allow users to explore data at different levels of detail.
- Integration with AI/ML: Utilizing machine learning algorithms to dynamically update infographics based on real-time data.
- Real-Time Visualization: Enhanced tools enable the creation of live, dynamic infographics that reflect current states and processes in PLM systems.
Relevance to PLM Practitioners
For PLM practitioners, general infographics offer several advantages:
- Enhanced Communication: They facilitate clearer communication among cross-functional teams by visualizing complex data.
- Improved Decision-Making: By presenting key data points visually, these tools help in making informed decisions more efficiently.
- Training and Onboarding: Infographics serve as effective training aids for new employees or stakeholders to quickly grasp PLM processes.
Top Articles Overview
- Data Governance Infographic:
- Explains the critical role of data governance in maintaining integrity and consistency across PLM systems.
- Demystifying Digital Threads Infographic:
- Breaks down how digital threads connect different stages of product lifecycle, enhancing transparency and traceability.
- Demystifying Digital Twins Infographic HD:
- Provides a high-definition visual guide to the concept, benefits, and implementation strategies for digital twins in engineering.
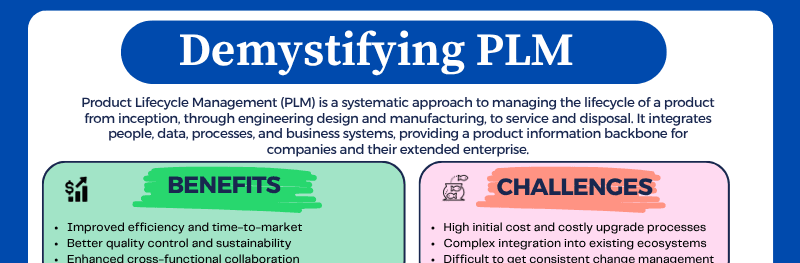
- Demystifying PLM Infographic 1 & 2:
- These infographics offer comprehensive overviews of PLM systems, processes, and best practices, demystifying complex concepts through easy-to-understand visuals.
In summary, general infographics are indispensable tools in the PLM/Engineering context, offering clear visual representation of intricate data and processes. As technology continues to evolve, their role in enhancing communication, decision-making, and training will only become more significant.